

Data portal
At Edalitics, we’ve developed a data portal designed to centralize all information and facilitate access to reports, analyses, and content from a single platform.
This portal allows users to view public reports, create and manage their own analyses, upload new reports, and enhance them with images and other visual resources. Furthermore, data source administrators and creators can customize the portal’s structure and design to meet the specific needs of each organization, transforming it into a collaborative, flexible, and fully configurable environment.
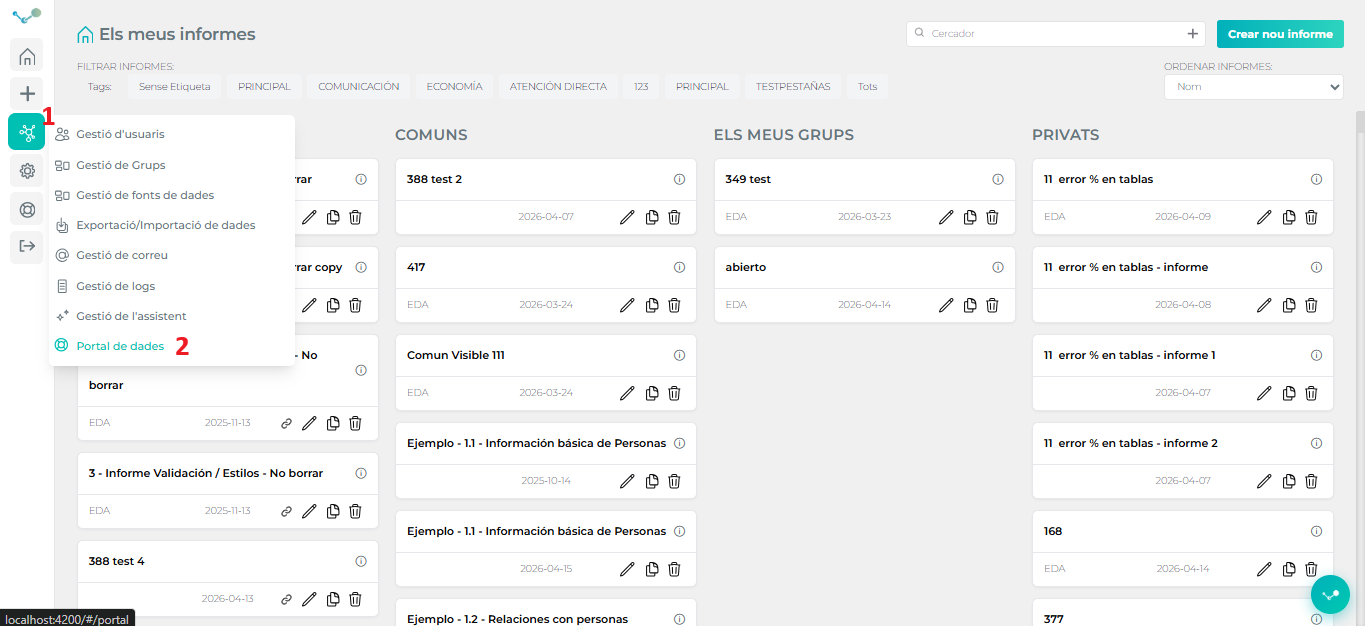
To access the Data Portal, go to the left-hand menu, select the third button (1), and access Data Portal (2). Within the portal, you will find a menu on the left side of the screen.
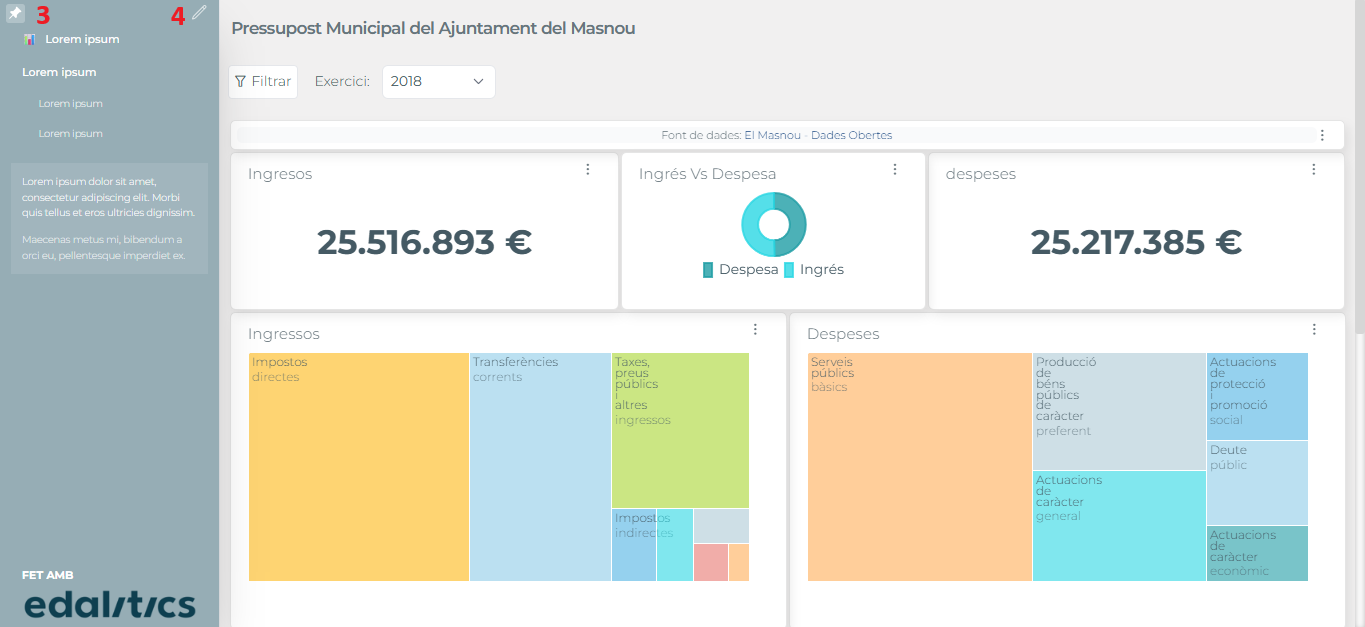
- In the top left of the menu, there’s a pin icon (3) that allows you to pin or unpin the menu.
- If you’re an admin or data source creator, you’ll also see a pencil icon (4) in the top right of the menu. This icon lets you edit the menu’s contents, including text, colors, and icons.
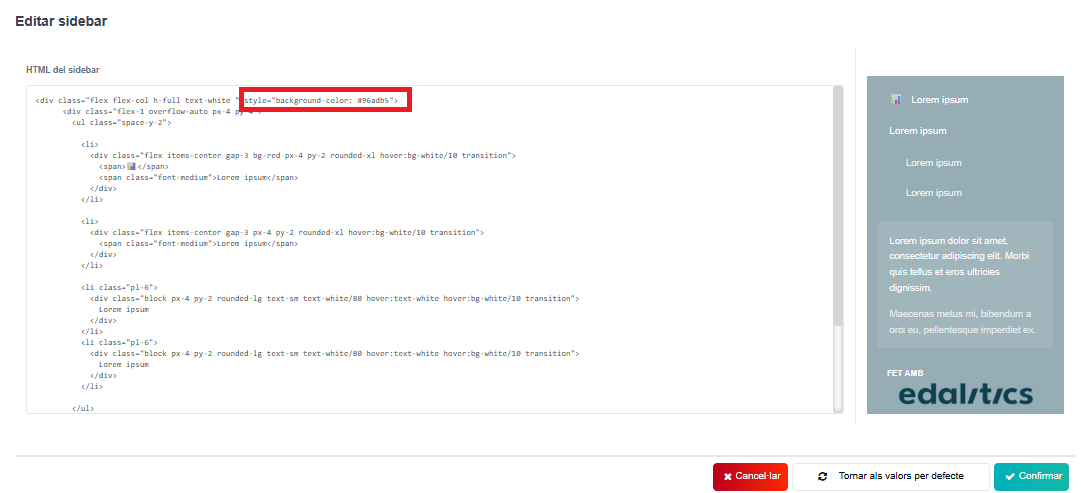
To change the background color of the menu, make sure it contains style=“background-color: color” and adjust the color value according to your needs.
Within the Data Portal you can:
- View public reports
- Add links to new reports in the menu (Important: add ?panelMode=true to the end of your report link)
- Create your own reports
- Add images to reports
- And manage other portal content