

Creating a report
Create reports with AI
Section titled “Create reports with AI”To create a new report, just click on the “new report” button on the main screen.
Next, you need to give it a name, choose the data model the report will be based on, and configure its privacy settings. To create the AI-powered report, describe the dashboards you want to include in the report in the box below. The report with the dashboards you described will be created shortly.
Video tutorial
Section titled “Video tutorial”Another option for creating AI-powered reports is through the Edalitics wizard, located in the bottom right corner. To generate the report, you must specify the data model on which the dashboards will be based. The wizard will create the report and provide you with a link, which you can click to access the report. The more specific your request, the better the report will be.
Video tutorial
Section titled “Video tutorial”Create reports without AI
Section titled “Create reports without AI”To create a new report, just click on the “new report” button on the main screen.
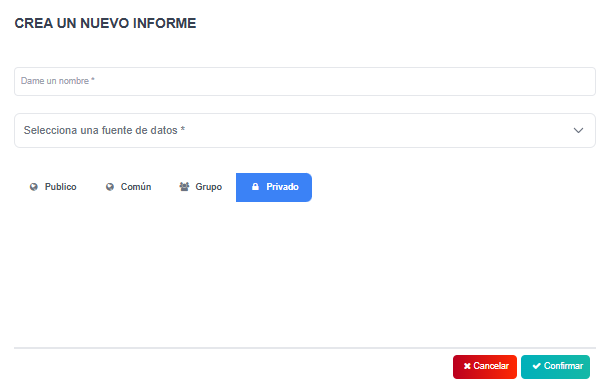
Then, you have to give it a name, choose the data model on which the report will be made and its privacy.
Once the report is configured, a “blank report” is generated with the title and a first available panel.
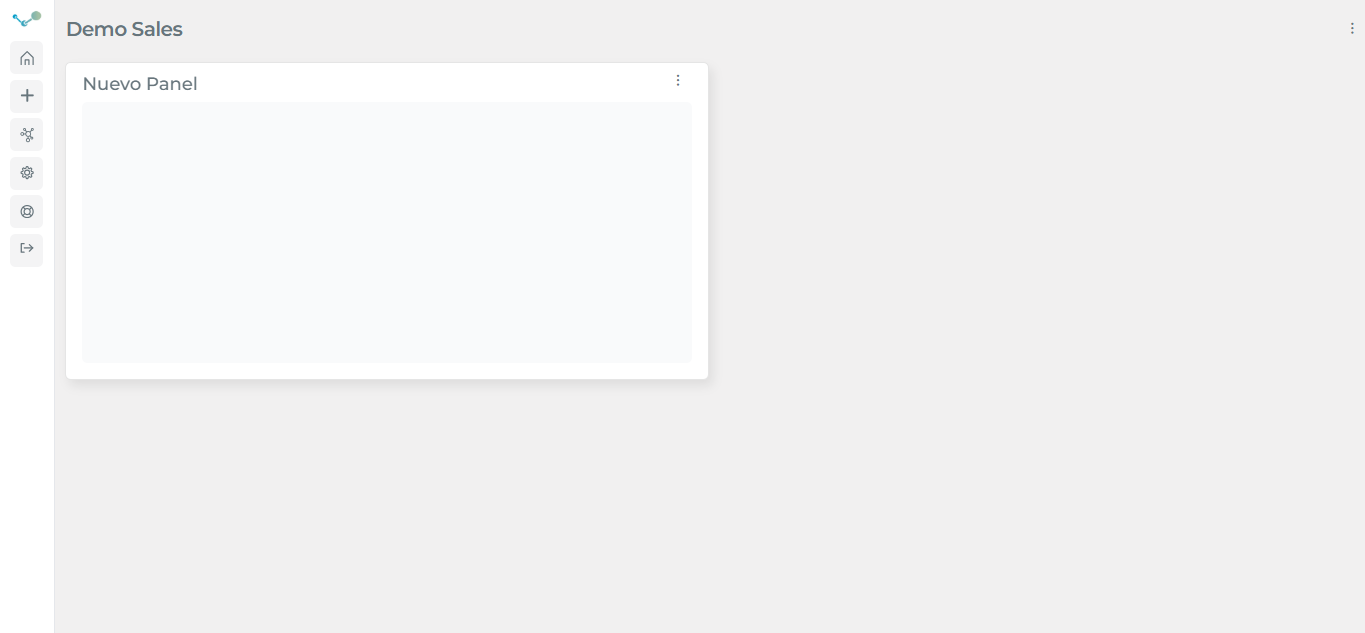
A report is configured by adding panels. The panels are the containers where we will place the different objects.
A report is made up of:
- Panels: A panel is a container where we will place a query object. Visualizing a graph, a map, an indicator, etc.
- Filters: Filters are located at the top of the report and can apply to one or more dashboards. Filters are multi-selector and can be date specific.
- Texts: edalitics allows you to have explanatory texts in the reports to locate clarifications in them.
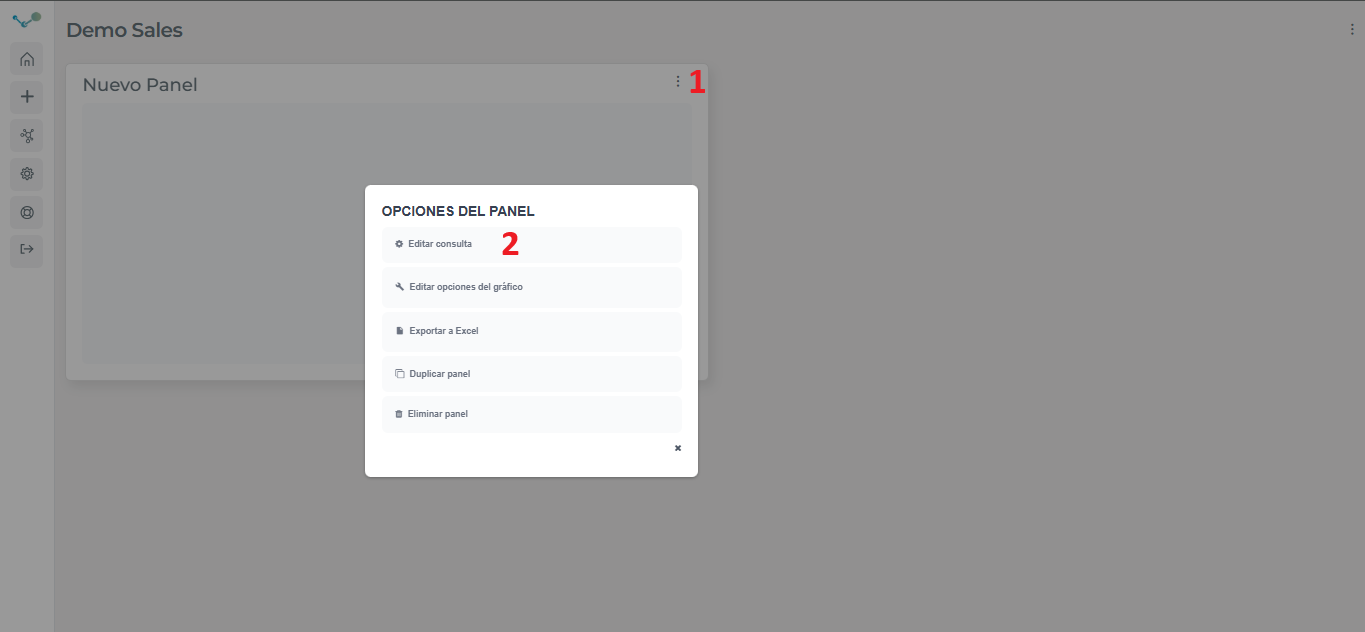
To configure a panel, click on the button located at the top right of the panel. Once the options window is open, you can edit the query on the data model.
The interface for setting up a panel query is specially designed to be intuitive. It presents entities and attributes with names defined in the data model and expressed in terms understandable by the user.
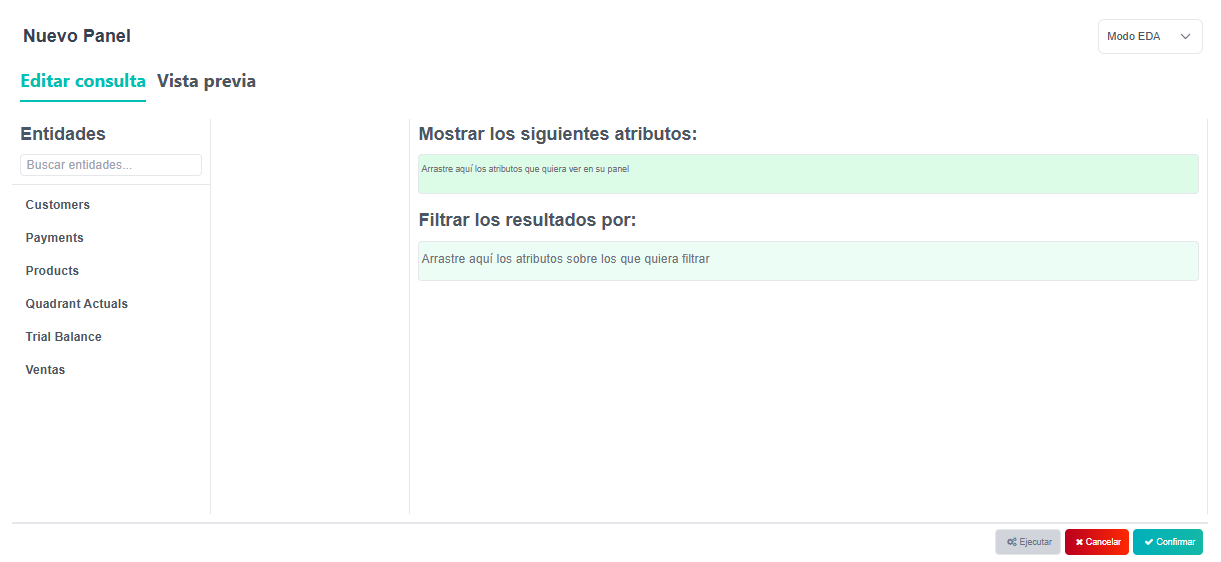
If you want to define a filter applicable to the panel query, you must drag the attribute to the filters box.
To filter by an attribute value, click on the attribute located in the selection bar or in the filter bar and define the desired filter.
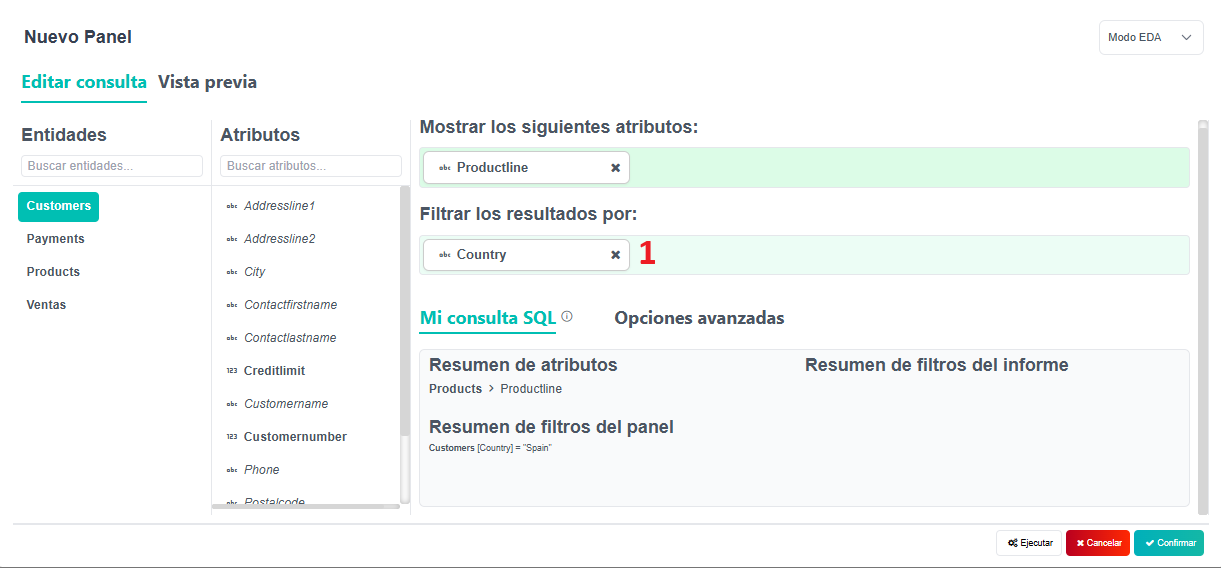
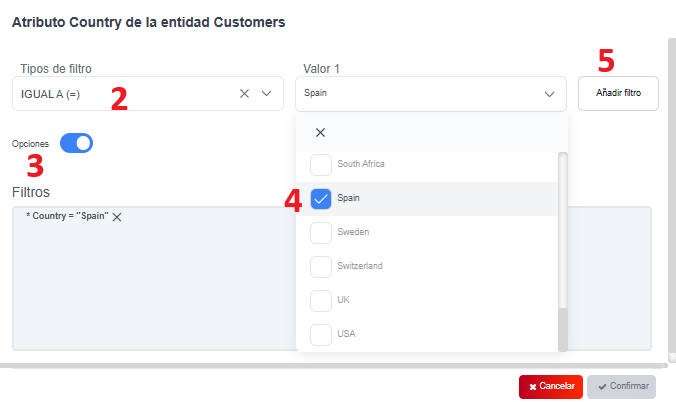
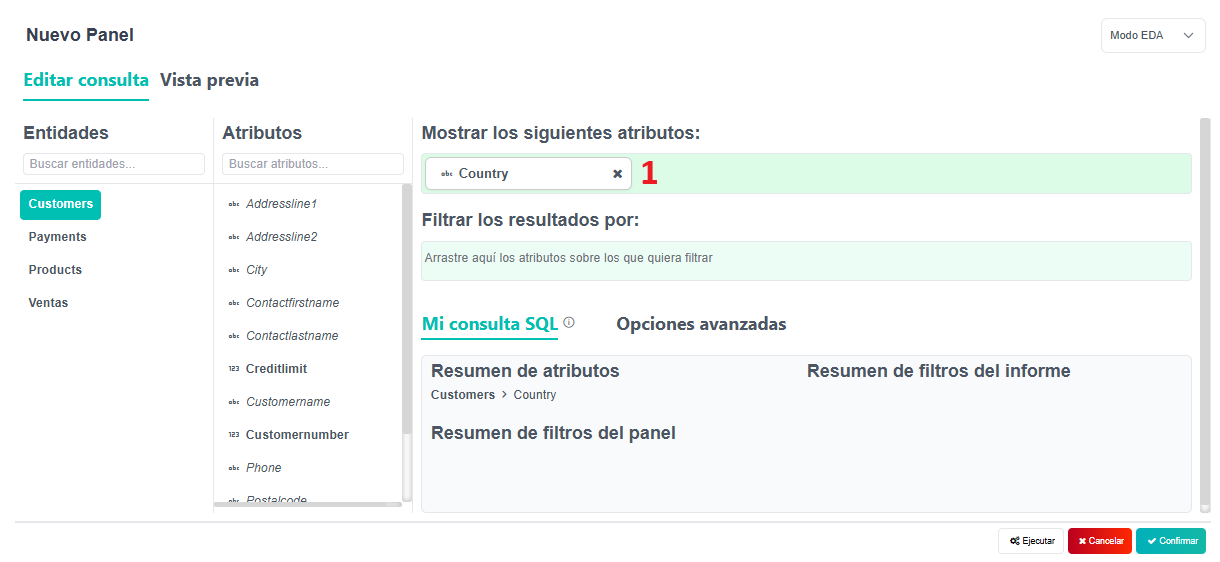
It is also possible to filter by an attribute chosen in the query.
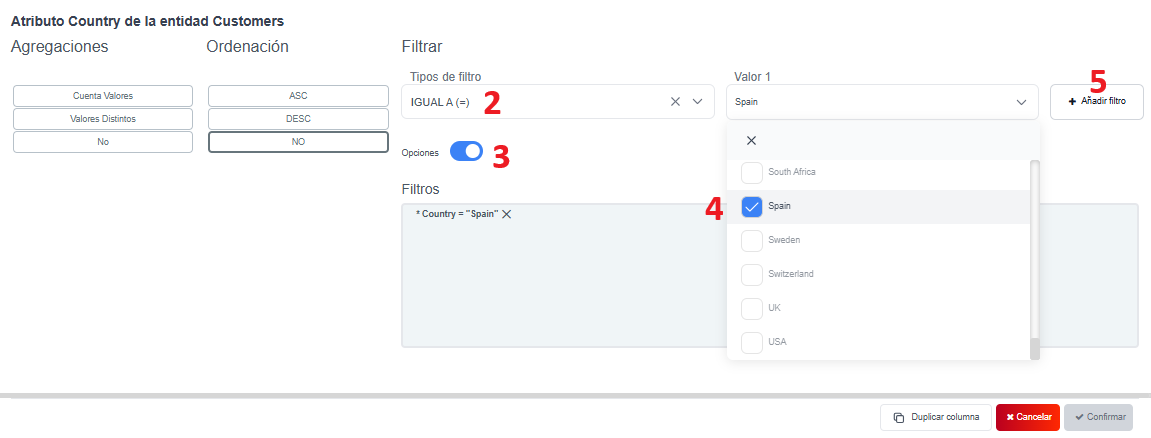
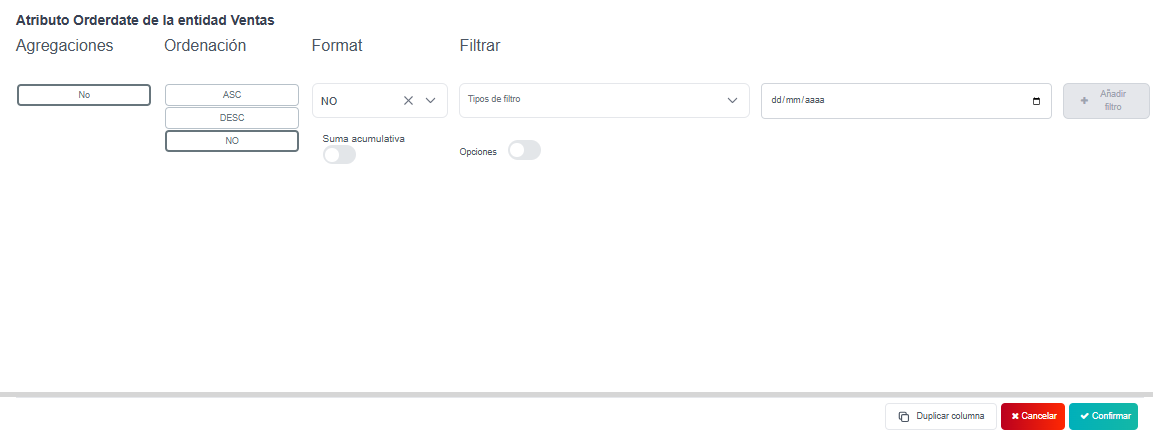
Once the attributes that we want to visualize and filter have been defined, we will proceed to configure the query by defining ordering, aggregations and formatting, if applicable, for each attribute. To do this, just click on the name of the attribute and adjust the available options.
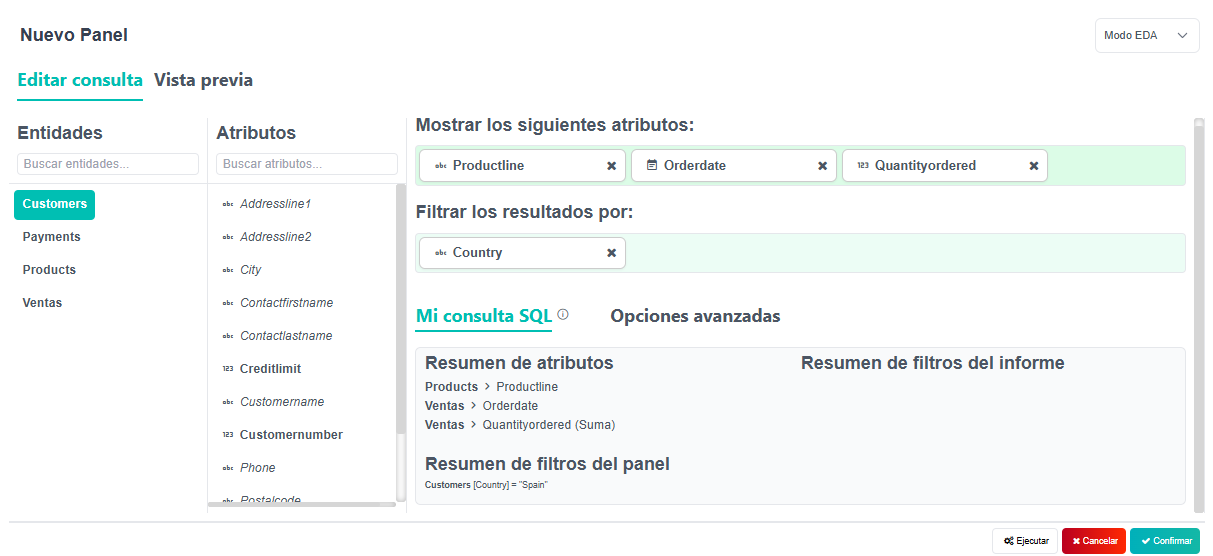
Finally, once we have the query defined we can execute it:
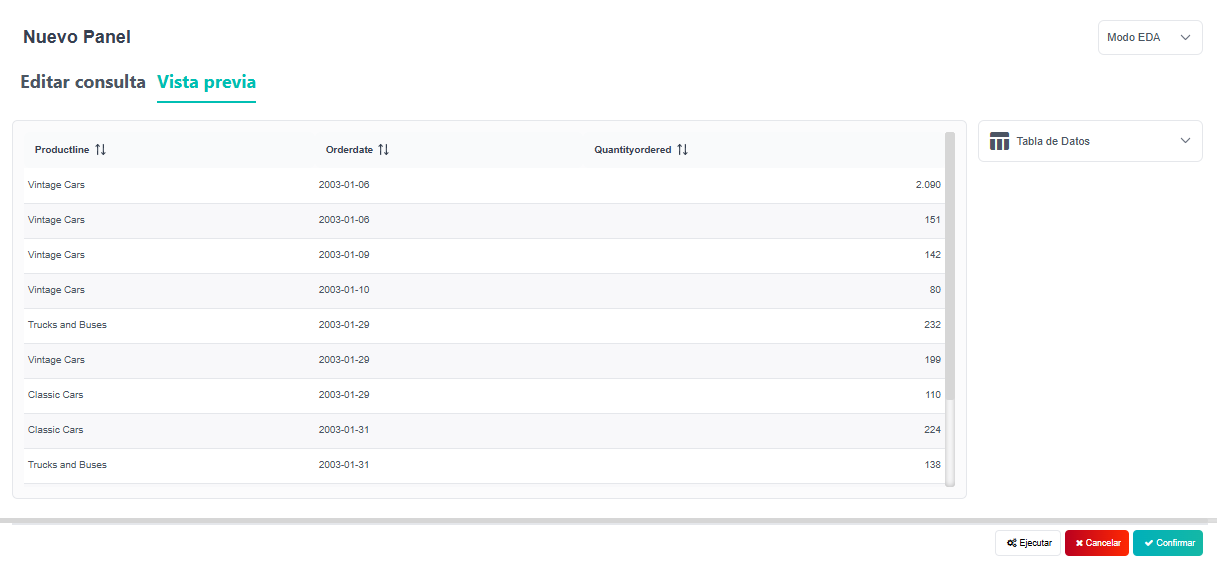
After this, a preview of the result will be displayed, by default as a data table.
At this time, you can choose the display. Keep the data table or select one of the available visualizations for the chosen data.
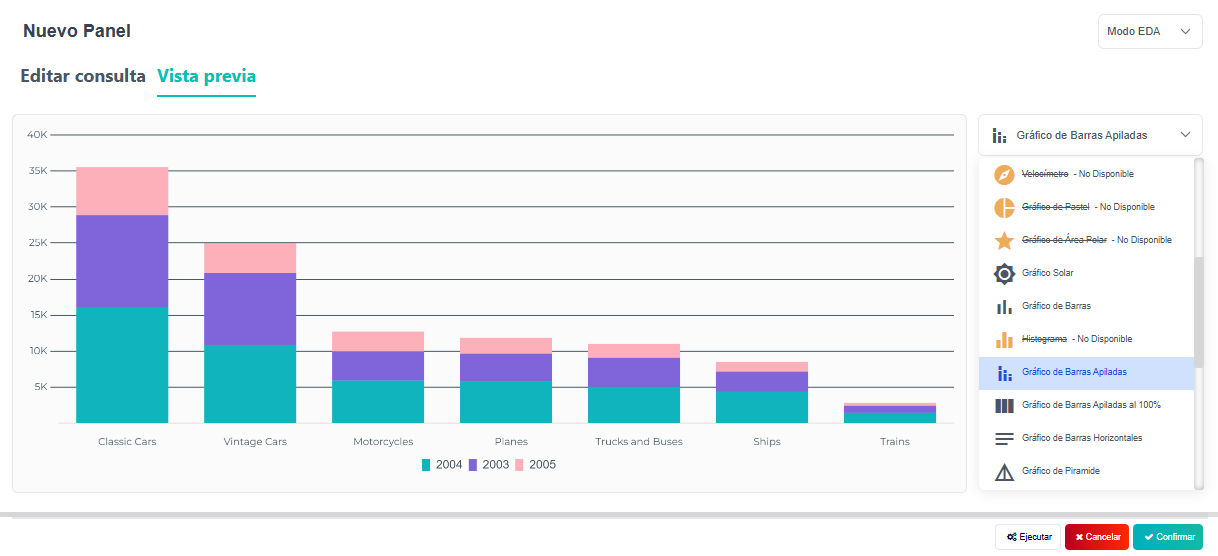
The list of visualizations shows the available options. It indicates that options are unavailable due to their specific requirements. Hovering over an unavailable option will display an explanation of why.
Once the desired visualization has been chosen, the panel configuration can be confirmed to obtain the desired result.
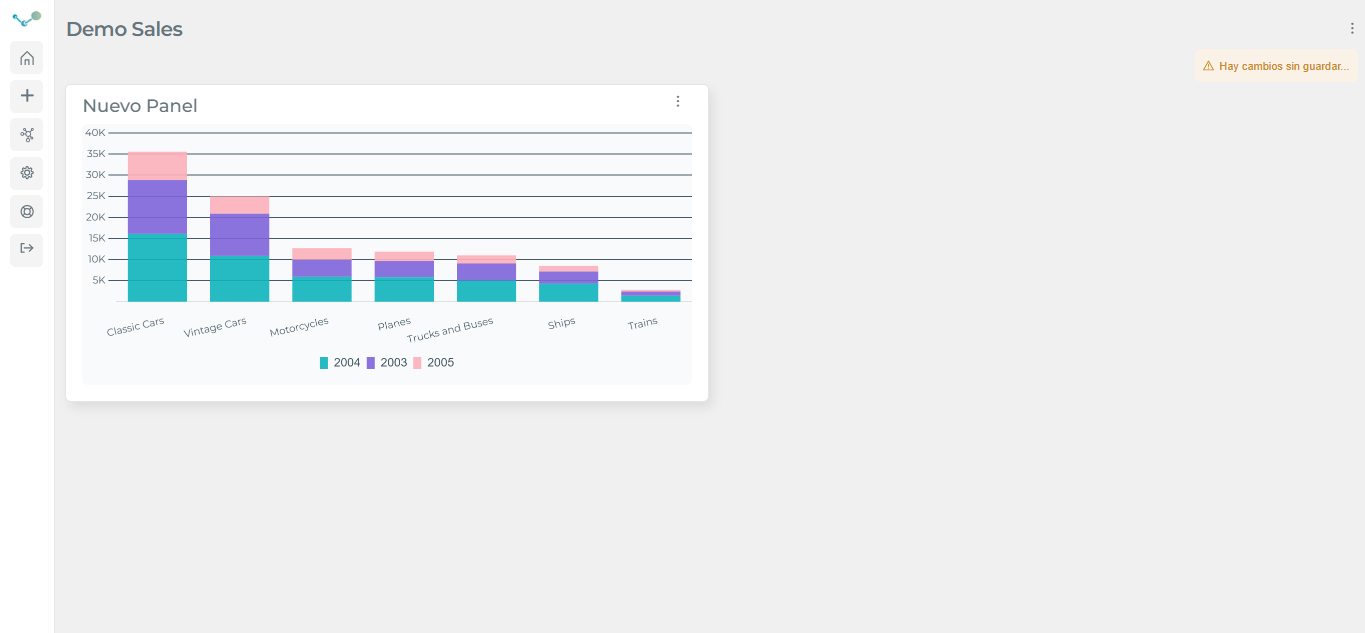
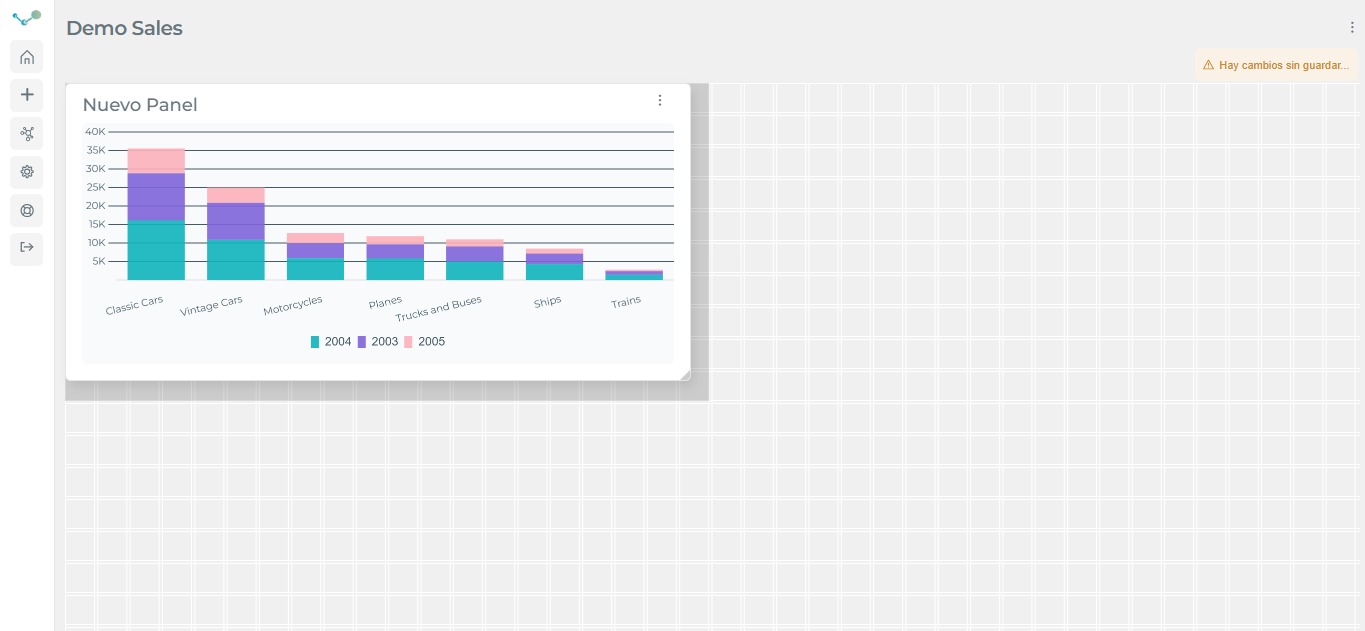
The panels can be resized as desired on the design grid by clicking and dragging an edge. Clicking the bottom right corner allows you to define the height and width.
Video tutorial
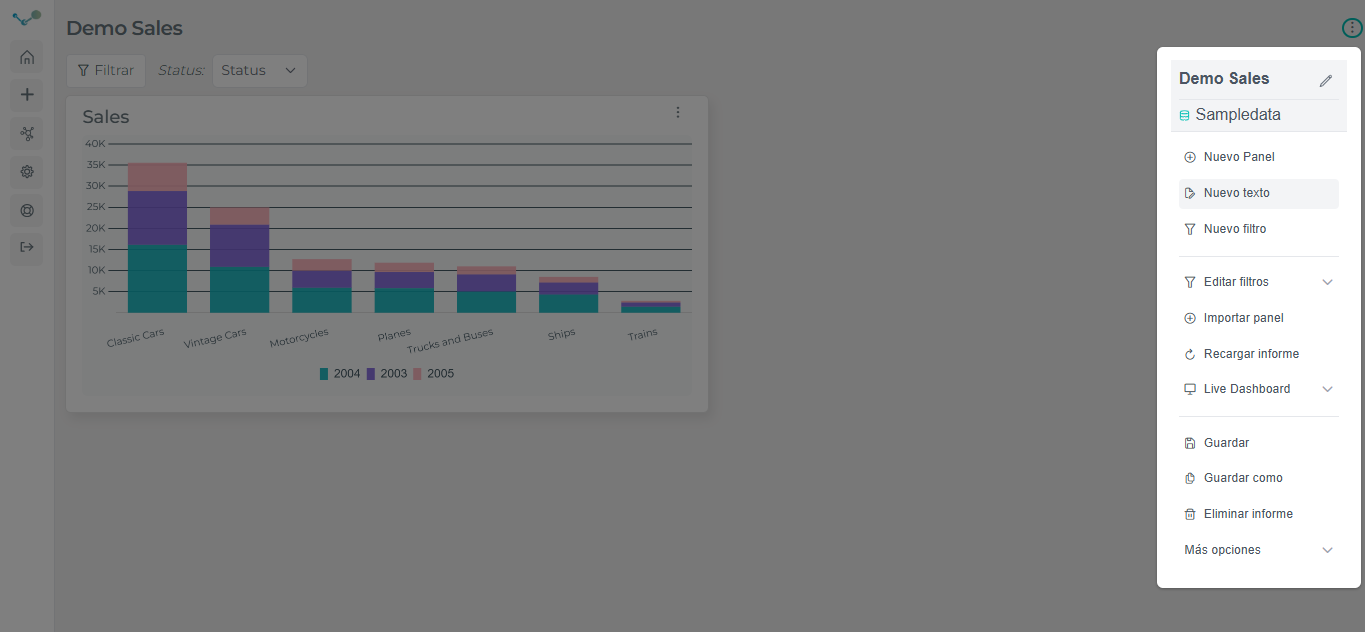
Section titled “Video tutorial”Sometimes, it is necessary to include explanatory text somewhere in the report. For this purpose, the Text component has been created, to be able to put a free text. In order to add a new text to the report, click on the higher right dropdown menu and then on the “New Text” button.
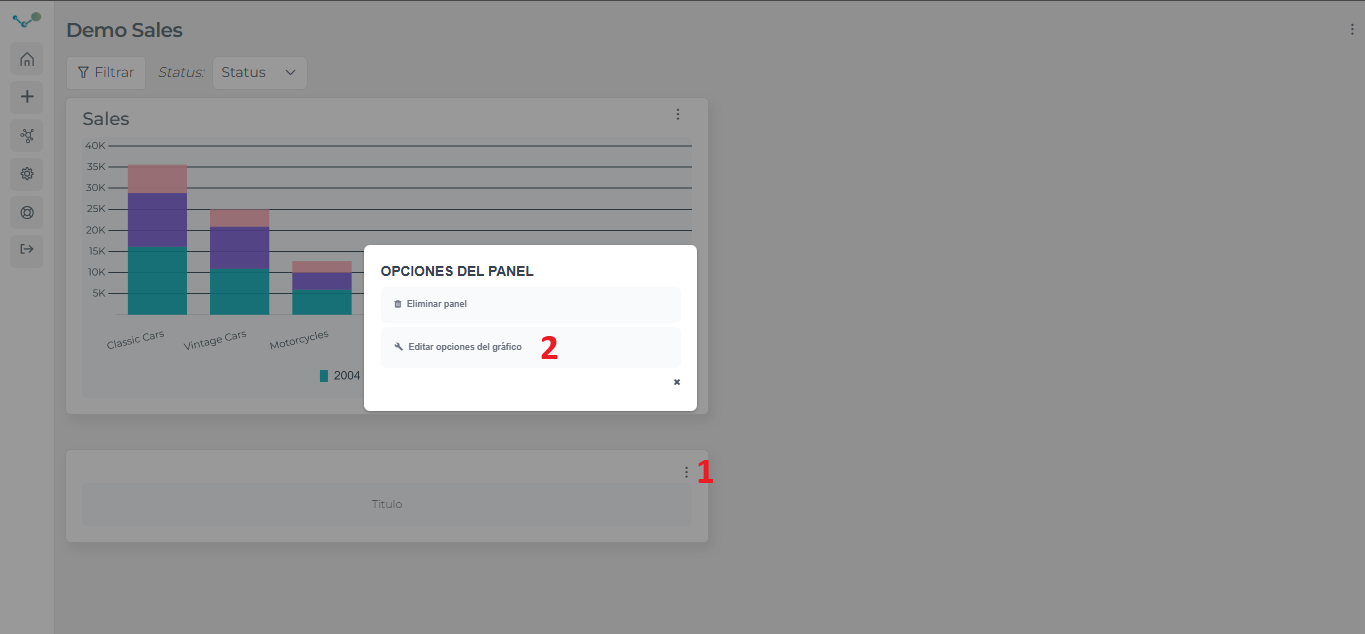
After that, we can enter texts as well as:
- Determine text size
- Determine the type of the text as well as the background and font colors
- Insert images
- Enter link
- Etc